Create Project
Create new project in Android Studio with steps as below:
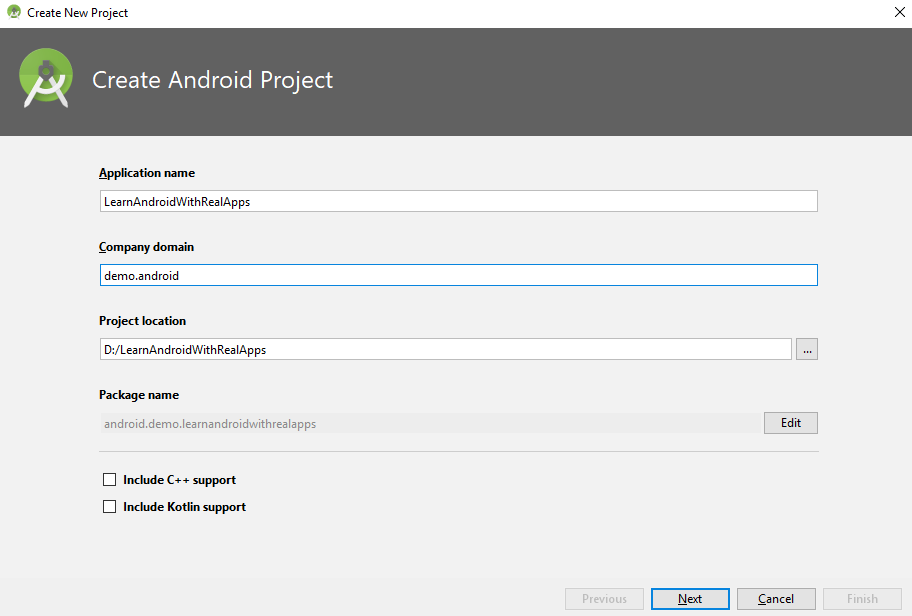
Step 1: Input Project Name and Select Project Location
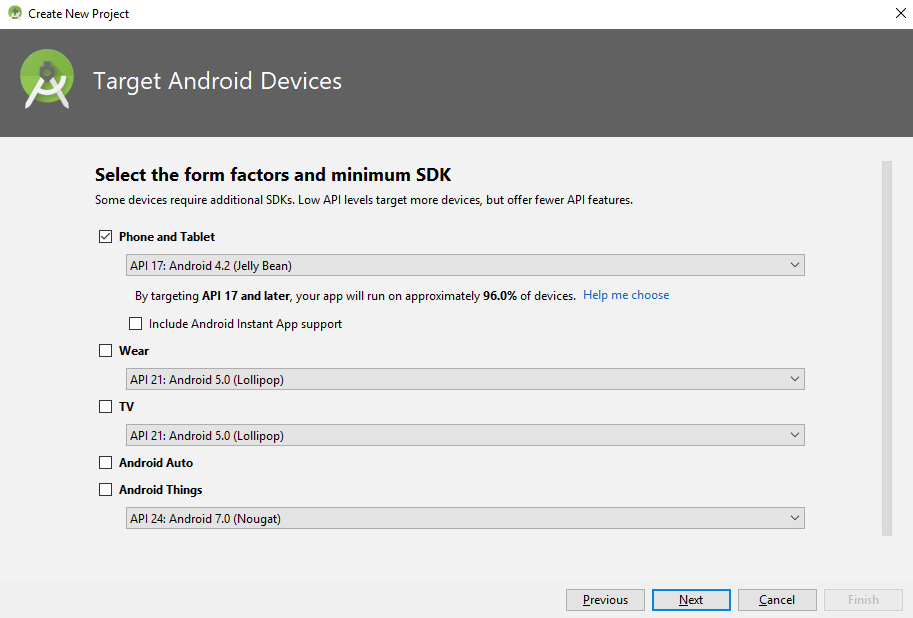
Step 2: Select SDK for Android App
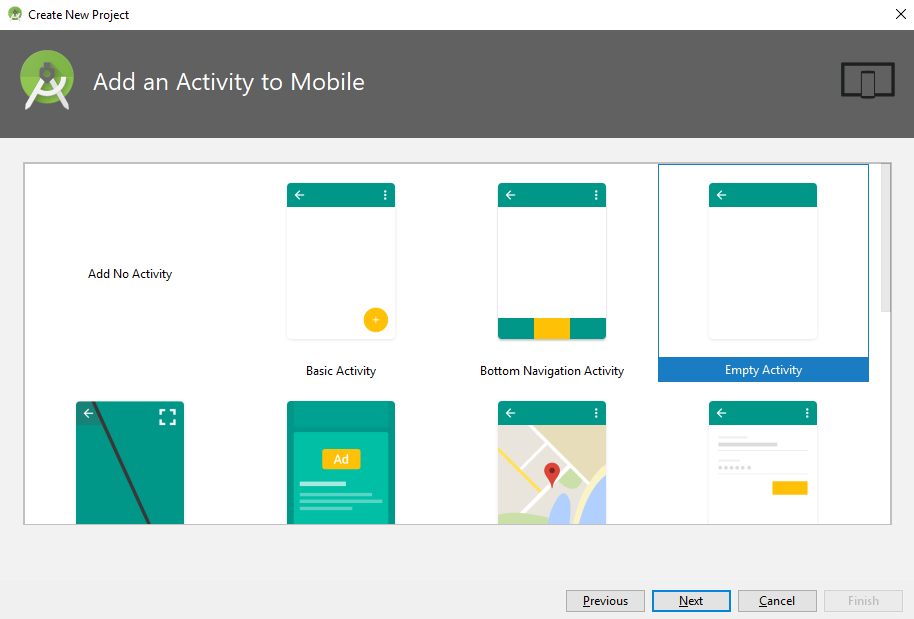
Step 3: Select Default Activity for App
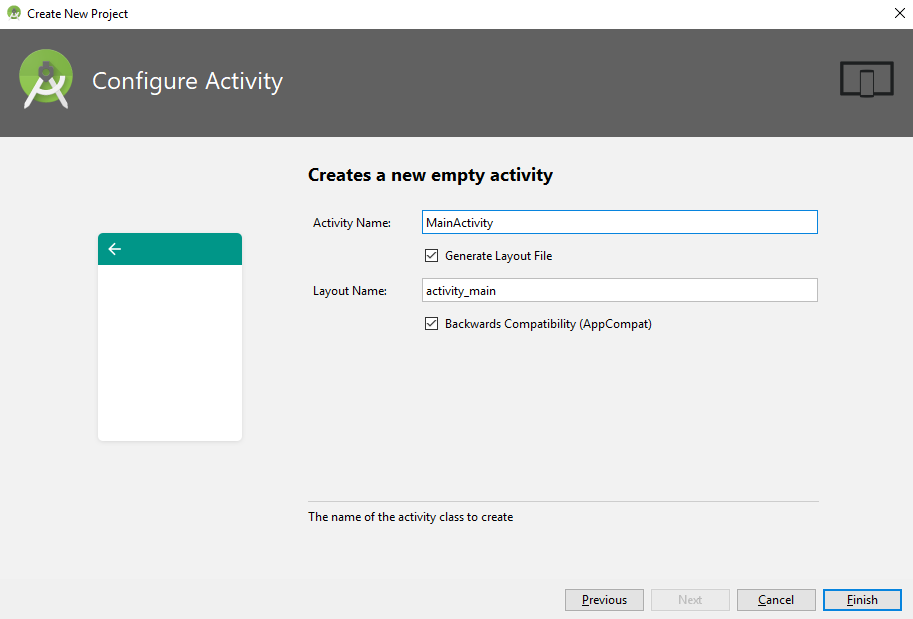
Step 4: Finish create project
Add Strings
Open res\values\strings.xml file and add new string as below:
<resources>
    <string name="app_name">Learn Android with Real Apps</string>
    <string name="election_results">Election Results</string>
    <string name="pie_chart">Pie Chart</string>
</resources>
Add Library as Dependencies
Open build.gradle file in Gradle Scripts and add new library as below:
repositories {
    maven { url 'http://repo1.maven.org/maven2' }
    maven { url 'https://jitpack.io' }
}

dependencies {
    implementation 'com.github.PhilJay:MPAndroidChart:v3.0.3'
}
Main Activity Layout
Open res\layout\activity_main.xml file and create layout as below:
<?xml version="1.0" encoding="utf-8"?>
<LinearLayout xmlns:android="http://schemas.android.com/apk/res/android"
    xmlns:tools="http://schemas.android.com/tools"
    android:layout_width="fill_parent"
    android:layout_height="fill_parent"
    android:background="#ffffff"
    android:orientation="vertical"
    tools:ignore="HardcodedText" >

    <com.github.mikephil.charting.charts.PieChart
        android:id="@+id/pieChart"
        android:layout_width="match_parent"
        android:layout_height="match_parent"/>

</LinearLayout>
Main Activity Class
Add code to MainActivity.java in android.demo.learnandroidwithrealapps package as below:
package android.demo.learnandroidwithrealapps;

import android.graphics.Color;
import android.os.Bundle;
import android.support.v7.app.AppCompatActivity;

import com.github.mikephil.charting.charts.PieChart;
import com.github.mikephil.charting.components.Description;
import com.github.mikephil.charting.data.PieData;
import com.github.mikephil.charting.data.PieDataSet;
import com.github.mikephil.charting.data.PieEntry;
import com.github.mikephil.charting.formatter.PercentFormatter;
import com.github.mikephil.charting.utils.ColorTemplate;

import java.util.ArrayList;

public class MainActivity extends AppCompatActivity {


    @Override
    protected void onCreate(Bundle savedInstanceState) {
        super.onCreate(savedInstanceState);
        setContentView(R.layout.activity_main);
        drawChart();
    }

    private void drawChart() {
        PieChart pieChart = findViewById(R.id.pieChart);
        pieChart.setUsePercentValues(true);

        ArrayList<PieEntry> yvalues = new ArrayList<PieEntry>();
        yvalues.add(new PieEntry(8f, "January", 0));
        yvalues.add(new PieEntry(15f, "February", 1));
        yvalues.add(new PieEntry(12f, "March", 2));
        yvalues.add(new PieEntry(25f, "April", 3));
        yvalues.add(new PieEntry(23f, "May", 4));
        yvalues.add(new PieEntry(17f, "June", 5));

        PieDataSet dataSet = new PieDataSet(yvalues, getString(R.string.election_results));
        PieData data = new PieData(dataSet);

        data.setValueFormatter(new PercentFormatter());
        pieChart.setData(data);
        Description description = new Description();
        description.setText(getString(R.string.pie_chart));
        pieChart.setDescription(description);
        pieChart.setDrawHoleEnabled(true);
        pieChart.setTransparentCircleRadius(58f);
        pieChart.setHoleRadius(58f);
        dataSet.setColors(ColorTemplate.VORDIPLOM_COLORS);
        data.setValueTextSize(13f);
        data.setValueTextColor(Color.DKGRAY);

    }

}
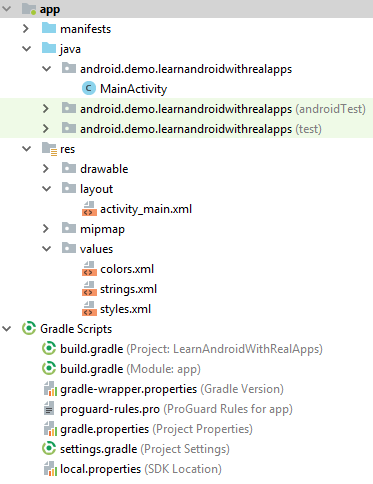
Structure of Project
Run App
Load Main Activity
